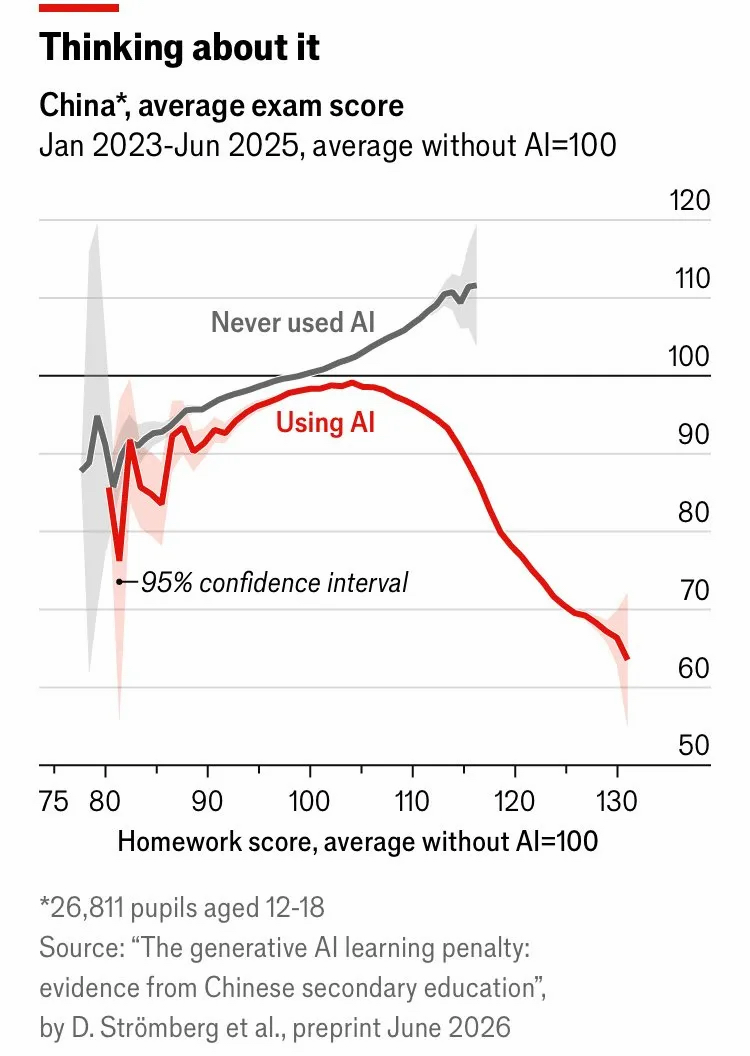
Using 30 months of panel data on 26,811 Chinese students in grades 7-12, it has been studied how generative AI affects homework productivity and learning.
-
Using 30 months of panel data on 26,811 Chinese students in grades 7-12, it has been studied how generative AI affects homework productivity and learning.
● X-Axis: Homework scores
● Y-Axis: Exam scores@metin This graph is interesting and mostly matches my expectation. If you spend the time to actually do the homework, you perform ok the exam (on average). No matter if you use AI or not.
-
Using 30 months of panel data on 26,811 Chinese students in grades 7-12, it has been studied how generative AI affects homework productivity and learning.
● X-Axis: Homework scores
● Y-Axis: Exam scores@metin I suppose this is one way of shoving bots toward 'human-level' performance...
-
@mklovenotcyber @metin Do I see Generative AI users dropping the absolute best exam scores, the best homework scores, and the lowest homework times?
Seems like a win-win-win!

I guess I gotta read the paper?
@mklovenotcyber@infosec.exchange @poleguy@mastodon.social @metin@graphics.social
Your interpretation of the exam-score graph is consistent with the assumptions I made of you upon seeing that you're pro-GenAI.
-
@metin @PapyrusBrigade I can't understand the graph... What are the axis?
-
@aoanla @mklovenotcyber @metin
Yes, the Economist points this out, too:
“The drop in exam scores was concentrated among students who rushed their homework. Those who used AI but spent as long on assignments as non-users paid little penalty. What matters, then, is how pupils use the technology. Those whose exam results remained strong were not simply copying and pasting answers to save time. More likely they used the chatbots as a personal tutor, perhaps to explain difficult concepts or help solve specific problems.”
https://www.economist.com/graphic-detail/2026/08/18/does-ai-stop-children-from-learning ($)
@gisiger @aoanla @mklovenotcyber @metin But put another way, AI had no gain when being used to study if they spent the same amount of time for similar test scores
-
@mklovenotcyber@infosec.exchange @poleguy@mastodon.social @metin@graphics.social
Your interpretation of the exam-score graph is consistent with the assumptions I made of you upon seeing that you're pro-GenAI.
@dzamie @mklovenotcyber @metin
Gen AI is utilizing the unceded words, thoughts, and images of a multitude... it's burning the planet... I wish it would go away.
The "win-win-win" is a joke. The ":-)" emoji was not enough.
It was not an "interpretation" of the exam-score... just an observation of a ridiculous, yet 'valid' way of reading the graphs... for humorous effect. Sorry if it wasn't clear I was joking.
I'm not sure what posts you saw of mine that caused you to conclude I'm pro-GenAI.
-
Using 30 months of panel data on 26,811 Chinese students in grades 7-12, it has been studied how generative AI affects homework productivity and learning.
● X-Axis: Homework scores
● Y-Axis: Exam scores@metin
Ouch! -
@dzamie @mklovenotcyber @metin
Gen AI is utilizing the unceded words, thoughts, and images of a multitude... it's burning the planet... I wish it would go away.
The "win-win-win" is a joke. The ":-)" emoji was not enough.
It was not an "interpretation" of the exam-score... just an observation of a ridiculous, yet 'valid' way of reading the graphs... for humorous effect. Sorry if it wasn't clear I was joking.
I'm not sure what posts you saw of mine that caused you to conclude I'm pro-GenAI.
@mklovenotcyber@infosec.exchange @poleguy@mastodon.social @metin@graphics.social
You did a good job of emulating the writing style of an AI bro: exuberant, confidently incorrect, and using more smilies than normal (though in hindsight, it being an emoticon rather than an emoji should have given me pause). The tone and "win-win-win" especially gave me my initial assumption, and nothing else about it gave me good reason to reject it.
So, I'm not sure what you mean by "valid," then - I thought at first that it might be a thin red tail above all the blue scores, but I only see the black axis (well, grey guideline) past the blue when I zoom in. I can't think of anything else it could be, though, unless you're trying to suggest spread as a useful metric.
-
Using 30 months of panel data on 26,811 Chinese students in grades 7-12, it has been studied how generative AI affects homework productivity and learning.
● X-Axis: Homework scores
● Y-Axis: Exam scores@metin This reminds me of something a very experienced and smart person told me about aviation safety standards. He said it doesn't matter what's in the standard as long as it makes you, and others, sit with the design longer. He thinks quality is more a function of time than of specific activities.
He'd probably like this paper a lot.
-
@mklovenotcyber@infosec.exchange @poleguy@mastodon.social @metin@graphics.social
You did a good job of emulating the writing style of an AI bro: exuberant, confidently incorrect, and using more smilies than normal (though in hindsight, it being an emoticon rather than an emoji should have given me pause). The tone and "win-win-win" especially gave me my initial assumption, and nothing else about it gave me good reason to reject it.
So, I'm not sure what you mean by "valid," then - I thought at first that it might be a thin red tail above all the blue scores, but I only see the black axis (well, grey guideline) past the blue when I zoom in. I can't think of anything else it could be, though, unless you're trying to suggest spread as a useful metric.
@dzamie @mklovenotcyber @metin Yeah, sometimes jokes don't land when done in text... I tried. ... and I habitually don't use actual emoji's... sticking to the emoticons is a stylistic choice.
By 'valid' I mean that the three things I claimed are factual. I see red at the far right of the "Exams Scores" graph, red at the top of thehomework scores, and red at the _bottom_ of homework time; for homework time _lower_ is better.
As usual, jokes just get funnier when you explain them.
Oh well -
@dzamie @mklovenotcyber @metin Yeah, sometimes jokes don't land when done in text... I tried. ... and I habitually don't use actual emoji's... sticking to the emoticons is a stylistic choice.
By 'valid' I mean that the three things I claimed are factual. I see red at the far right of the "Exams Scores" graph, red at the top of thehomework scores, and red at the _bottom_ of homework time; for homework time _lower_ is better.
As usual, jokes just get funnier when you explain them.
Oh well@mklovenotcyber@infosec.exchange @poleguy@mastodon.social @metin@graphics.social
Huh, yeah, I don't see what you're seeing on the exam graph. I'm willing to blame my phone screen for that.
Sorry for the accusation. I'm glad you took the time to explain it, even if it did kill the joke.
-
@mklovenotcyber@infosec.exchange @poleguy@mastodon.social @metin@graphics.social
Huh, yeah, I don't see what you're seeing on the exam graph. I'm willing to blame my phone screen for that.
Sorry for the accusation. I'm glad you took the time to explain it, even if it did kill the joke.
@dzamie @mklovenotcyber @metin No worries...
I'm on a giant screen or I might not have noticed this little detail nor made the joke.
Despite my negative AI sentiment, I do find, as others have noted, that AI tends to frequently be an amplifier of people's already existing tendencies (both good or bad). So the super nerd who already was going to get the top score, and then used AI to help study wasn't going to land at the bottom end of that distribution just because of using AI.
-
Using 30 months of panel data on 26,811 Chinese students in grades 7-12, it has been studied how generative AI affects homework productivity and learning.
● X-Axis: Homework scores
● Y-Axis: Exam scores@metin I'm actually surprised that homework score appears to be such a good predictor of exam score. Are they determined in comparable settings in China (open-book, parents that could help, time pressure, ...)?
-
@metin This graph is interesting and mostly matches my expectation. If you spend the time to actually do the homework, you perform ok the exam (on average). No matter if you use AI or not.
@Segebodo @metin
This is a fascinating graph in terms of "is AI even useful"* At basically no point on the graph does using AI get the student better (or worse) exam results than not; the AI is not useful for improving exam scores
* At around 55 minutes homework time students get better homework scores without affecting their exam scores
* Phoning it in on homework with AI lets students get high homework scores, but then they do poorly on the exam; presumably this compromises the teachers' and parents' (and students' own) ability to monitor progress, in addition to whatever direct effect the AI may have on learning
-
@metin fascinating, but the chart prompts so many questions for me.
Why are there below average genAI homeworks at all?
Is it valid to compare exam scores from the high scoring homework groups this way? Aren't there presumably a lot of bad students hidden in the lower right red line? Or in other words: shouldn't we expect a reordering of true performance in the genAI group?
The more interesting takeaway is the consistent outperforming from non-AI using students. Or is that the main message? The chart sets a different focus with the way it is presented.
Q: "Why are there below average genAI homeworks at all?"
A: Some teachers penalise students for untruthful content (LLM "hallucinations") or if it's clear the student has not proofread what they've used from a LLM. Maybe that's why.
-
@metin fascinating, but the chart prompts so many questions for me.
Why are there below average genAI homeworks at all?
Is it valid to compare exam scores from the high scoring homework groups this way? Aren't there presumably a lot of bad students hidden in the lower right red line? Or in other words: shouldn't we expect a reordering of true performance in the genAI group?
The more interesting takeaway is the consistent outperforming from non-AI using students. Or is that the main message? The chart sets a different focus with the way it is presented.
@mklovenotcyber @metin my takeaway is: students using AI, who get higher scores homework assignments, get significantly lower scores on exams.
-
@mklovenotcyber @metin Do I see Generative AI users dropping the absolute best exam scores, the best homework scores, and the lowest homework times?
Seems like a win-win-win!
I guess I gotta read the paper?
@poleguy @mklovenotcyber @metin no: gen-ai exam scores are significantly *lower*.
-
@gisiger @aoanla @mklovenotcyber @metin But put another way, AI had no gain when being used to study if they spent the same amount of time for similar test scores
@wesley @gisiger @mklovenotcyber @metin I mean, the paper shows a much smaller negative effect for using AI whilst still doing homework (which might not even be significant) but yeah.
(The paper also notes that this is in contrast to various studies that suggest AI tutors can have a positive effect on student learning - generally its argument is that those are idealised, and that this real world study is not going to look as positive. This is a point I have also made to people proposing AI tutoring tools, so I am naturally sympathetic to it, but it's also hard to see other good explanations.)
-
@poleguy @mklovenotcyber @metin no: gen-ai exam scores are significantly *lower*.
@deborahh @mklovenotcyber @metin
See the rest of my conversation with @mklovenotcyber
Yes, the _mean_ is lower, and the side below the mean is significantly lower, but the very highest scores do look to be red, which seems to indicate they are from Gen AI users.
I have not yet read the paper, but when I do I'm interested to see if they have thoughts on this.
(In case anyone missed it, based on this tiny red peak value, I was _making a joke._)
-
@metin fascinating, but the chart prompts so many questions for me.
Why are there below average genAI homeworks at all?
Is it valid to compare exam scores from the high scoring homework groups this way? Aren't there presumably a lot of bad students hidden in the lower right red line? Or in other words: shouldn't we expect a reordering of true performance in the genAI group?
The more interesting takeaway is the consistent outperforming from non-AI using students. Or is that the main message? The chart sets a different focus with the way it is presented.
@mklovenotcyber @metin The way I interpret the chart is dividing students that use AI vs don't use AI. That doesn't mean that they use AI for everything, so average or lower-than-average homework scores might indicate students that use AI a little. That also could explain why the gap between AI and no-AI is narrower there.